
Your solar payback period equals your net system cost divided by your annual financial benefit. Net system cost is total installation price minus upfront incentives. Annual financial benefit is your electricity bill savings plus any ongoing incentives you receive each year. That single formula is the foundation of every solar energy savings calculation, and everything else in this guide builds on it.
“You can calculate your break-even point, or solar payback period, by dividing the final cost (the total cost of your solar panel system minus any upfront incentives) by your annual financial benefit (the amount you save on electricity combined with annual incentives). The faster the cost of electricity increases, the shorter your payback period and the greater your savings will be.”
Before you run the numbers, gather these inputs:
- Monthly kWh consumption from your last 12 utility bills
- Local electricity rate (cents per kWh) from your utility or the DOE Energy Information Administration’s Utility Rate Database
- Solar system size (kW DC) and estimated annual output (kWh/year)
- Total installed cost before incentives
- Federal and state incentives you qualify for
- Net metering policy from your utility, which determines how excess power is credited
Your final savings figure depends heavily on your location, roof configuration, and financing method. No universal formula exists; site-specific data and your utility’s policies dictate the real numbers.
Pro Tip: Before sizing a solar system, complete an energy efficiency audit. Reducing your baseline consumption first shrinks the system you need, which lowers your upfront cost and improves your payback period.
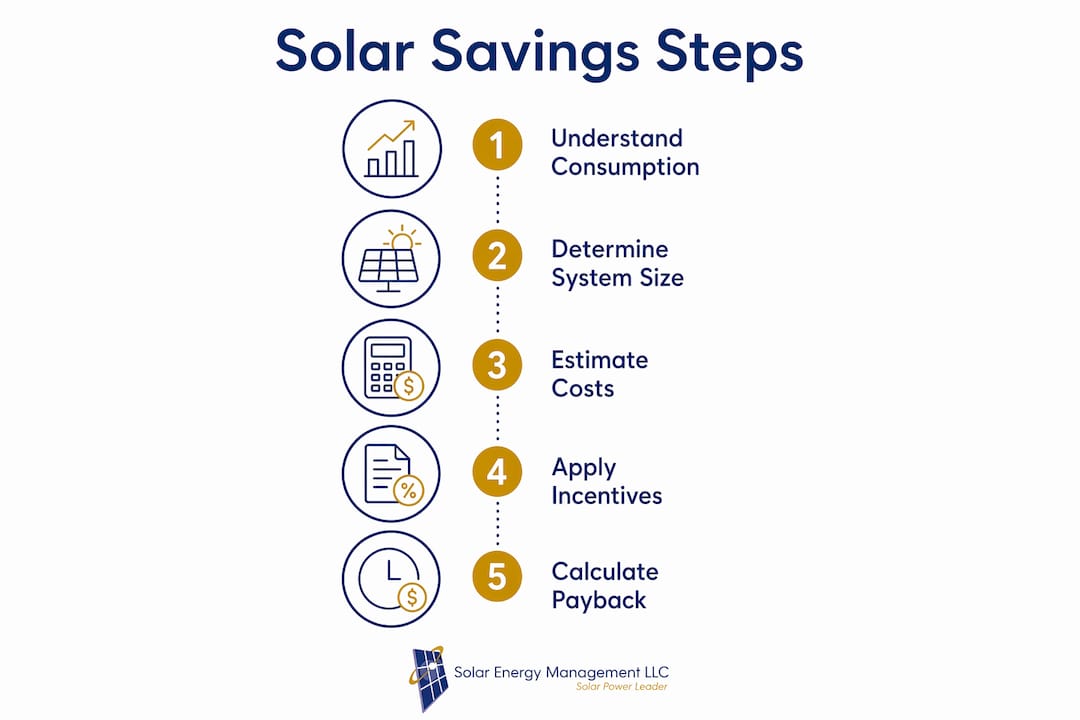
Step 1: Understand your current energy consumption
Your utility bill is the starting point for any credible solar energy cost analysis. Look for the monthly kWh figure, not the dollar amount, because rates change but consumption tells you what the panels must actually replace.
Pull 12 consecutive months of bills and calculate your annual total, then divide by 12 for your monthly average. Florida homeowners, for example, often see sharp spikes in summer due to air conditioning loads that can nearly double winter consumption. Ignoring that seasonal swing leads to undersized systems and inflated savings projections.
Also think ahead. If you plan to add an electric vehicle, a heat pump, or other high-draw appliances, build that future load into your estimate now. A system sized only for today’s usage may fall short within a few years.
Collect these data points from your bills and utility portal:
- Monthly kWh usage for each of the past 12 months
- Average and peak monthly demand (kW), if listed
- Current rate per kWh, including tiered or time-of-use pricing
- Any fixed monthly charges that solar will not eliminate
- Utility’s net metering compensation rate for excess generation
Step 2: Determine the size and potential output of your solar system
System size and roof characteristics set the ceiling on how much electricity you can generate. Panels on a south-facing roof with a 15–40 degree tilt produce the most output in the continental United States. Shading from trees or neighboring structures can cut production by a meaningful margin, so a shading analysis is not optional.

NREL’s PVWatts Calculator is the industry standard for estimating solar output. Enter your address, DC system size, module type, tilt, azimuth, and system losses, and PVWatts returns monthly and annual kWh production using decades of local weather data. PVWatts version 5 applies a default 14% system loss factor that accounts for soiling, wiring, mismatch, and inverter inefficiency, producing estimates that align closely with real-world measured performance.
Pro Tip: PVWatts outputs an energy range based on 30 years of historical weather data. Use the low end of that range for conservative financial planning, not the midpoint.
Key inputs to confirm before running PVWatts:
- DC system size in kilowatts
- Module type: Standard, Premium, or Thin Film
- Roof tilt angle in degrees
- Azimuth (compass direction the panels face; 180° = true south)
- System losses percentage (default 14% is appropriate for most residential systems)
- Location confirmed on the map tab for correct solar resource data
Step 3: Estimate the total cost of solar installation
Installation cost is the largest variable in your payback calculation, and it varies by state, roof type, and system complexity. The Lawrence Berkeley National Laboratory’s Tracking the Sun report tracks residential installed prices across the country and serves as a reliable benchmark when comparing installer quotes.
Financing method changes your effective cost significantly. A cash purchase gives you the cleanest payback calculation: net cost divided by annual savings. A solar loan with no down payment may produce immediate monthly savings if your loan payment is lower than your old electricity bill, but total interest paid extends the true payback horizon. A power purchase agreement (PPA) means you do not own the panels; you pay a fixed rate for the power they produce, which can still yield net savings without any upfront investment.
Common cost categories to account for:
- Solar panels (modules)
- String inverter or microinverters
- Racking and mounting hardware
- Electrical wiring, conduit, and disconnect
- Permitting and inspection fees
- Labor for installation
- Utility interconnection application fee
- Optional battery storage system
Step 4: Account for government incentives available in the US
The federal Investment Tax Credit (ITC) reduces your system cost by 30% in 2026, applied directly against your federal income tax liability. For a $20,000 system, that is a $6,000 reduction in net cost, which shortens payback considerably. If you finance through a PPA, the system owner claims the ITC and may pass savings to you through a lower per-kWh rate.
Beyond the federal credit, many states offer additional rebates, property tax exemptions, and sales tax exemptions on solar equipment. Florida, for instance, exempts solar equipment from state sales tax and from property tax reassessment. The DSIRE database (Database of State Incentives for Renewables and Efficiency) lists current programs by state and is the most reliable place to verify what applies to your address.
Incorporate incentives this way:
- Upfront incentives (ITC, state rebates): subtract from total system cost before calculating payback
- Ongoing annual incentives (performance-based payments, SRECs): add to your annual financial benefit
- Net metering credits: treat as part of your annual electricity savings, valued at your retail rate or the utility’s buyback rate, whichever your tariff specifies
Step 5: Calculate your solar savings and payback period
With your inputs assembled, the calculation is straightforward. Here is a worked example for a Florida homeowner:
- Total installed cost: Example figure
- Federal ITC: Estimated based on percentage of system cost
- Net cost after incentives: Calculated net cost after deductions
- Monthly electricity savings: Estimated monthly savings
- Annual electricity savings: Monthly savings times 12
- Payback period: Net cost divided by annual savings
When a payback period falls below 10 years, most homeowners find that solar is financially more attractive than any other low-risk investment available to them over the same time horizon.
For a more complete picture, the Savings-to-Investment Ratio (SIR) measures whether your solar investment recovers its full cost over the system’s lifetime. An SIR above 1 means you come out ahead; the DOE’s SIR calculator adjusts for state electricity rates and accounts for the time value of money. Net metering policy also shapes the annual benefit figure: utilities that compensate excess generation at full retail rate produce higher annual savings than those using a lower avoided-cost rate.
Pro Tip: Model your savings at two electricity rate escalation scenarios, say 2% and 4% annual increases. Faster rate growth shortens payback and raises your total lifetime return, so the range shows you the realistic floor and ceiling.
Step 6: Use trusted online solar savings calculators and tools
NREL’s PVWatts Calculator remains the most authoritative free tool for production estimates, combining satellite-based solar irradiance data with site-specific inputs. The DOE’s Solar Energy Technologies Office also publishes the Homeowner’s Guide to Solar, which walks through shading analysis, roof assessment, and financing options in plain language.
For Florida-specific financial modeling, Solar Energy Management’s solar savings checklist covers local utility rates, net metering rules, and state incentives in one place. Cross-referencing at least two tools before finalizing your numbers reduces the risk of relying on a single optimistic projection.
Pro Tip: After running any online calculator, have a licensed installer review the output. Professional solar consultations catch site constraints, utility interconnection limits, and shading factors that no web tool can fully replicate.
Key capabilities to use in these tools:
- Customize DC system size and module type for your specific equipment
- Adjust azimuth and tilt to match your actual roof geometry
- Download monthly and hourly production reports for detailed cash flow modeling
- Input your local electricity rate to convert kWh output into dollar savings
Additional considerations: ongoing maintenance costs and system degradation
Solar panels lose efficiency gradually over time. Annual degradation averages 0.5% per year, meaning a system producing 10,000 kWh in year one produces roughly 9,500 kWh by year ten. Over a 25-year system life, that compounding loss is real and should be factored into your long-term ROI model.
Maintenance costs are generally low for residential systems but not zero. Budget for periodic panel cleaning, inverter replacement (typically once over a 25-year span), and occasional electrical inspection. Factoring these costs into your payback model yields a more honest forecast than assuming zero ongoing expense.
Key maintenance and degradation factors to include in your calculation:
- Annual production degradation: approximately 0.5% per year
- Inverter replacement cost, typically needed once during system life
- Panel cleaning, especially in dusty or pollen-heavy environments
- Monitoring system subscription fees, if applicable
- Roof repair costs if panels must be removed and reinstalled
Solar Energy Management helps you calculate and capture real savings
Calculating solar savings accurately requires more than a spreadsheet. Solar Energy Management brings over 20 years of independent consulting experience to Florida homeowners and business owners who want a financially sound decision, not just an optimistic estimate.

Unlike a sales-driven installer, Solar Energy Management provides objective financial modeling, feasibility studies, and system design guidance with no pressure to buy a specific product. The firm’s consultants apply the federal 30% ITC, Florida-specific incentives, and your actual utility tariff to build a payback model grounded in real numbers. For business owners, the solar ROI calculator and commercial consulting services address load profile analysis, demand charge reduction, and battery storage integration. Get a solar savings assessment from Solar Energy Management and know exactly what your system will return before you sign anything.
Key Takeaways
Accurate solar savings calculations combine net system cost, annual electricity savings, incentives, and site-specific production data to produce a reliable payback period and ROI.
| Point | Details |
|---|---|
| Core payback formula | Divide net system cost (total cost minus upfront incentives) by annual financial benefit to get payback years. |
| Federal ITC in 2026 | The Investment Tax Credit reduces your system cost by 30%, directly shortening your payback period. |
| PVWatts for production | NREL’s PVWatts Calculator uses a default 14% system loss and local weather data for site-specific output estimates. |
| Degradation matters | Solar panels lose approximately 0.5% efficiency per year; include this in any 20-to-25-year ROI model. |
| Solar Energy Management | Provides independent financial modeling and feasibility studies for Florida homeowners and businesses seeking accurate savings projections. |
FAQ
What is the basic formula for calculating solar payback period?
Subtract upfront incentives from your total system cost, then divide by your annual financial benefit (electricity savings plus annual incentives). The result is your payback period in years.
How does the federal ITC affect my solar savings calculation?
The federal Investment Tax Credit reduces your net system cost by 30% in 2026, which directly lowers the numerator in your payback formula and shortens the time to break even.
What does an SIR above 1 mean for my solar investment?
A Savings-to-Investment Ratio above 1 means your solar system recovers its full investment cost through utility bill savings over its lifetime, accounting for the time value of money.
How accurate is NREL’s PVWatts Calculator?
PVWatts uses decades of local solar irradiance and weather data with a default 14% system loss factor, making it the most widely trusted free tool for residential production estimates in the US.
Does solar panel degradation significantly affect long-term savings?
At approximately 0.5% annual efficiency loss, a system’s output declines meaningfully over 20–25 years. Including degradation in your model gives you a more realistic lifetime savings figure than assuming constant production.
Recommended
- Solar Savings Checklist for Florida Homeowners 2026 – Commercial + Residential Solar Power Florida
- Solar Panel Return On Investment Calculator: Florida Guide – Commercial + Residential Solar Power Florida
- Microgrids for Homes: The Future of Energy Savings – Commercial + Residential Solar Power Florida
- Is Home Solar Worth It in Florida? a 2026 Financial Guide – Commercial + Residential Solar Power Florida


